Le swag est arrivé!!!
🐾starring Guillaume-en-Égypte🐾 OVID’s future depends on the support of those who know and value what we do. And with a reduced advertising budget this year, we need to be creative.So … voila!! OVID announces our new line of merchandise! The t-shirt is made of 100% ring-spun cotton and is soft and comfy. Our tee is […]

Survey results are in!
Thank you to all of you who contributed your feedback! We appreciated your thoughts and will look to implement your suggestions for improvements. This was our first ever survey, and we got thirty meaty responses – the longer comments are below the graphs. There were certain hypotheses cleared up – one about whether to convert […]
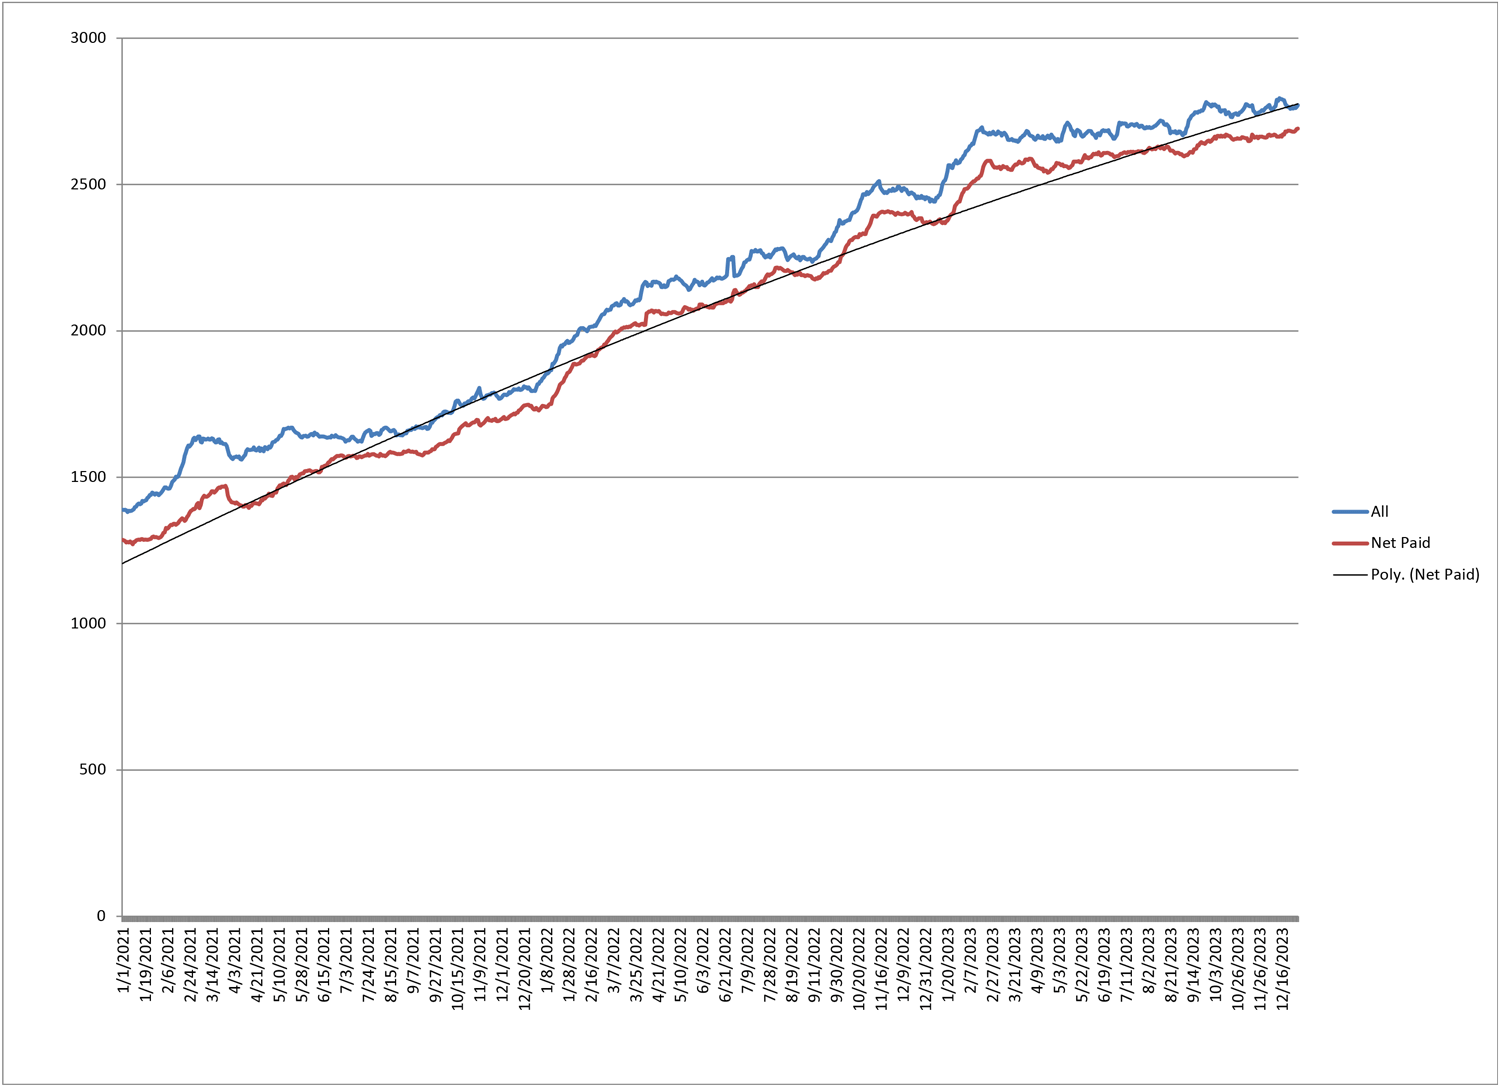
Member Movement through 31 December 2023
Happy new year! OVID ended the year at a new all-time high. Thank you for your continued support.
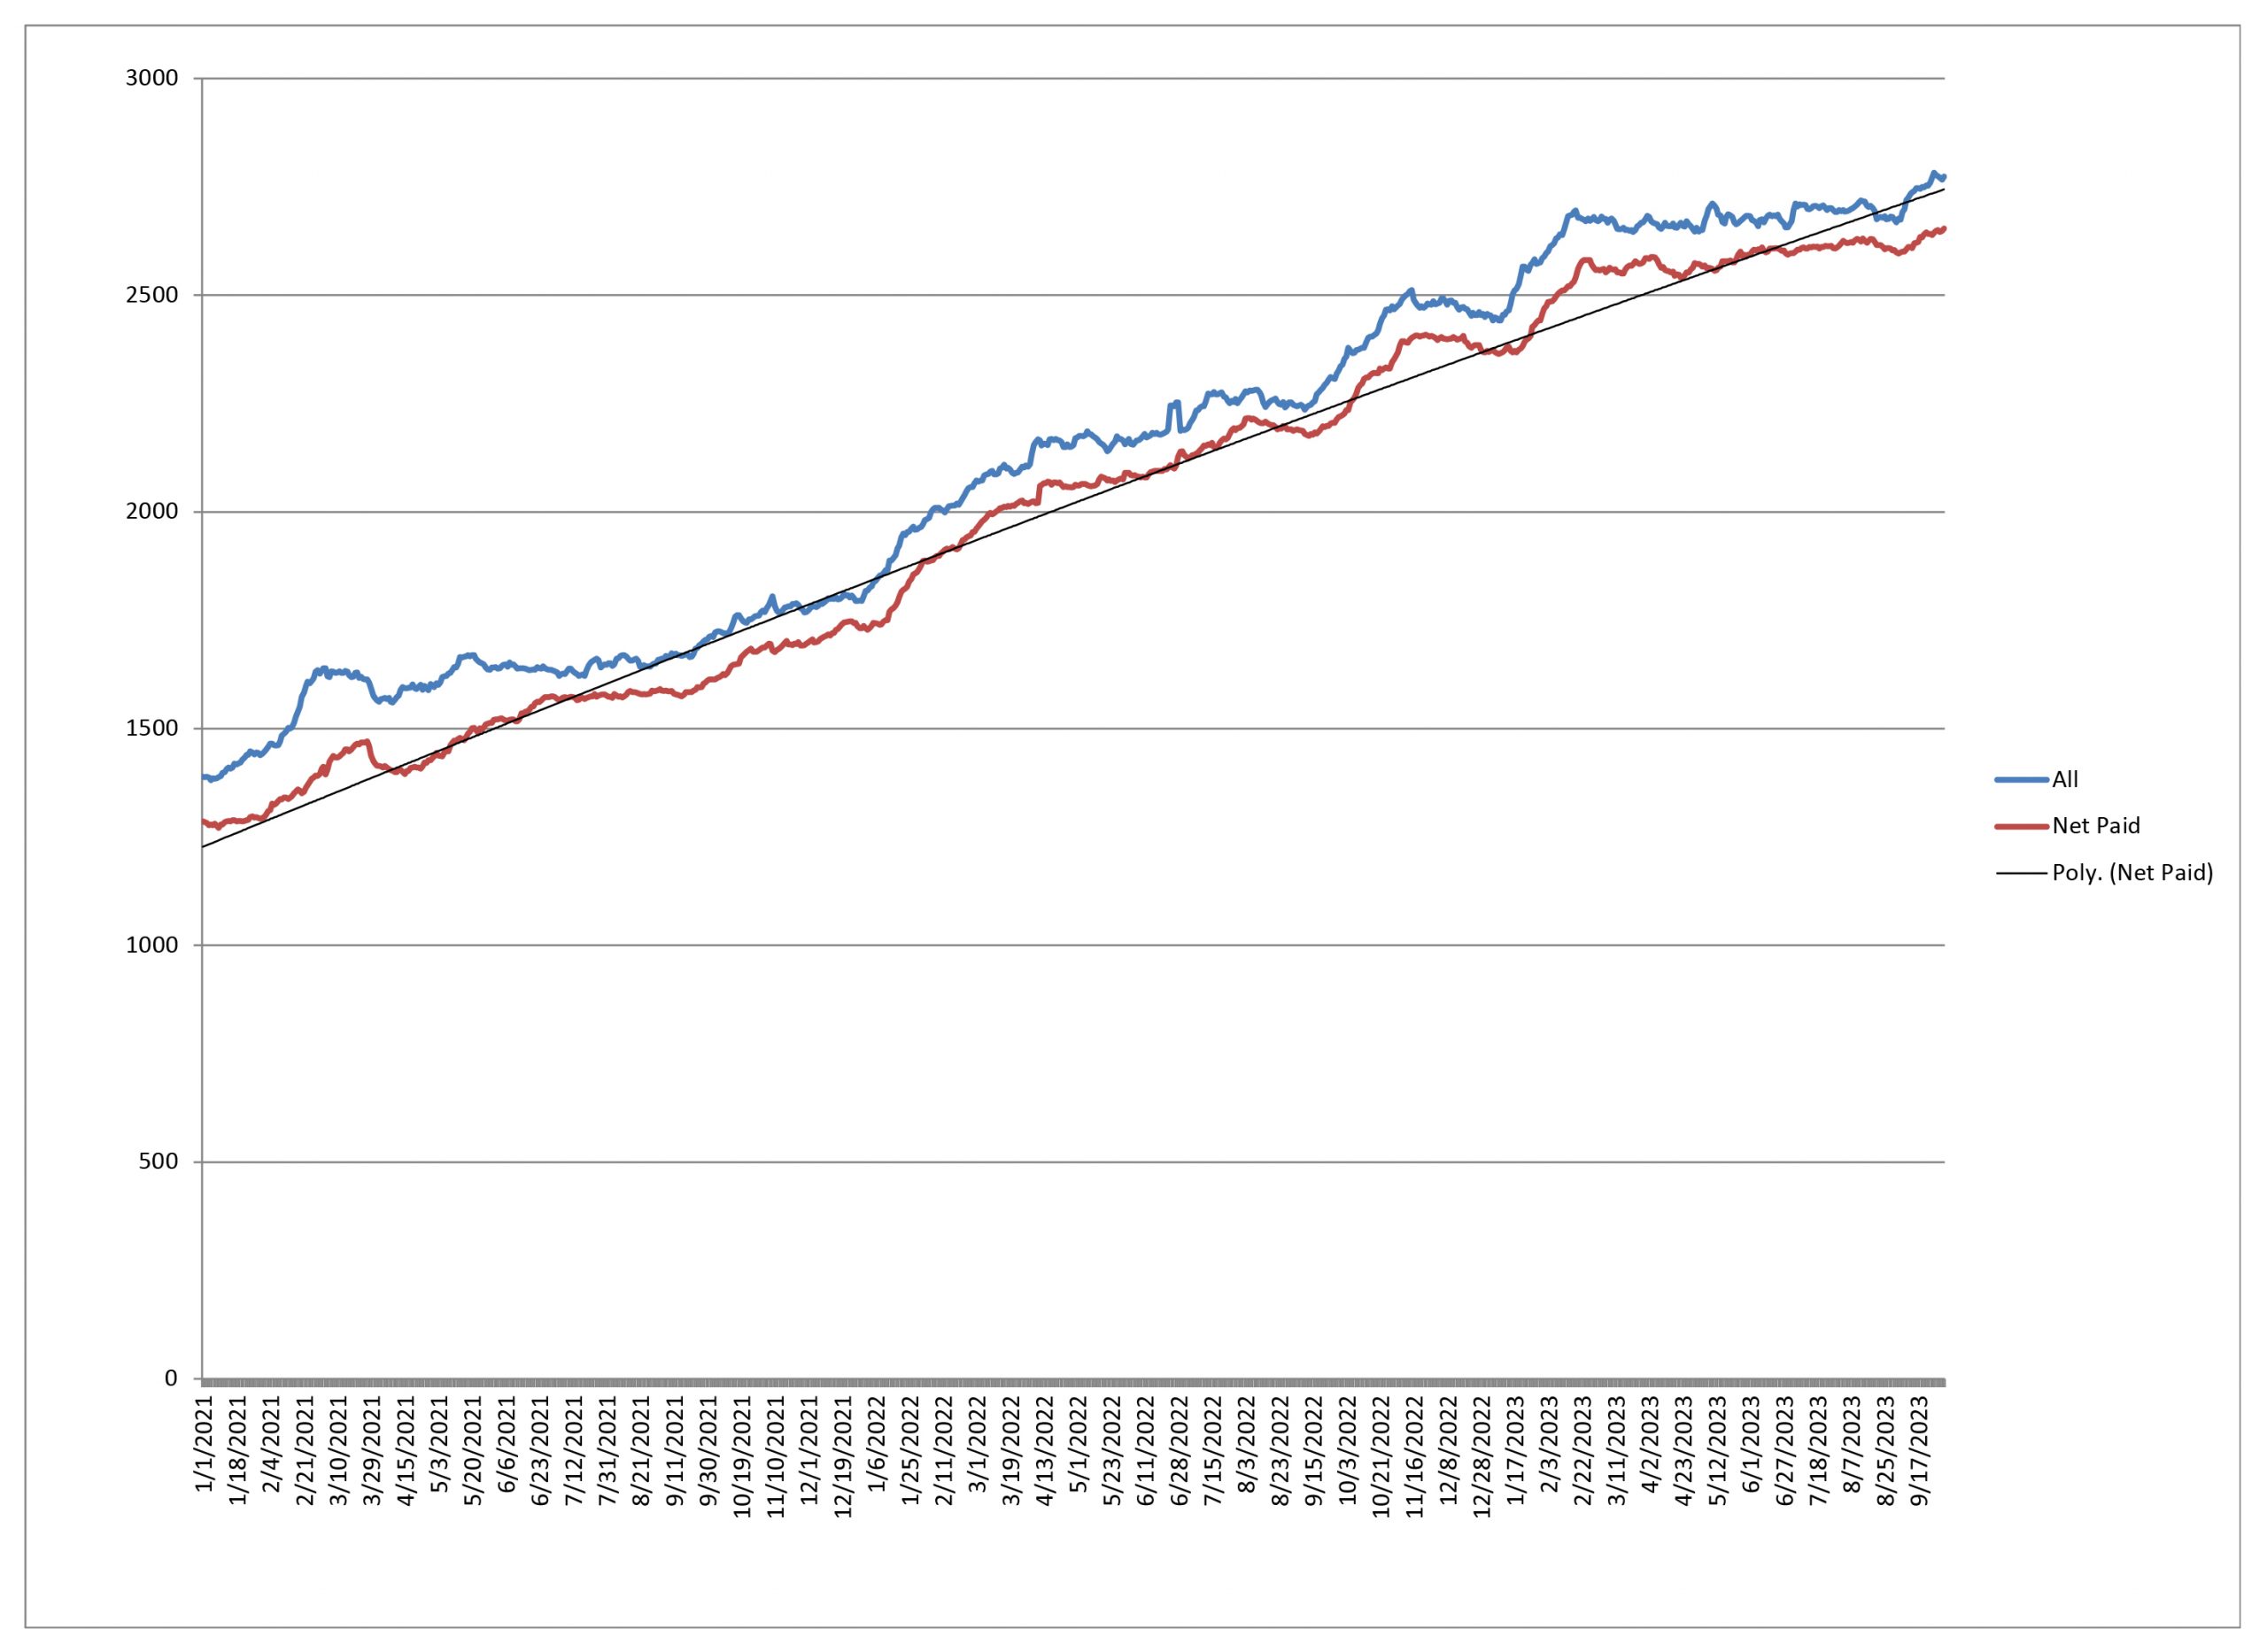
Member Movement through 30 September 2023
Will we sustain the momentum, or see it tail off?
Member Movement through 31 July 2023
It’s been a while since we posted this chart of our membership (subscriber) movements. As you can see it’s a mixed bag: It’s slow going, and the number of paying members have been fairly flat the past couple of months. But—they haven’t gone down, and, in fact, we did hit an all-time high just before […]
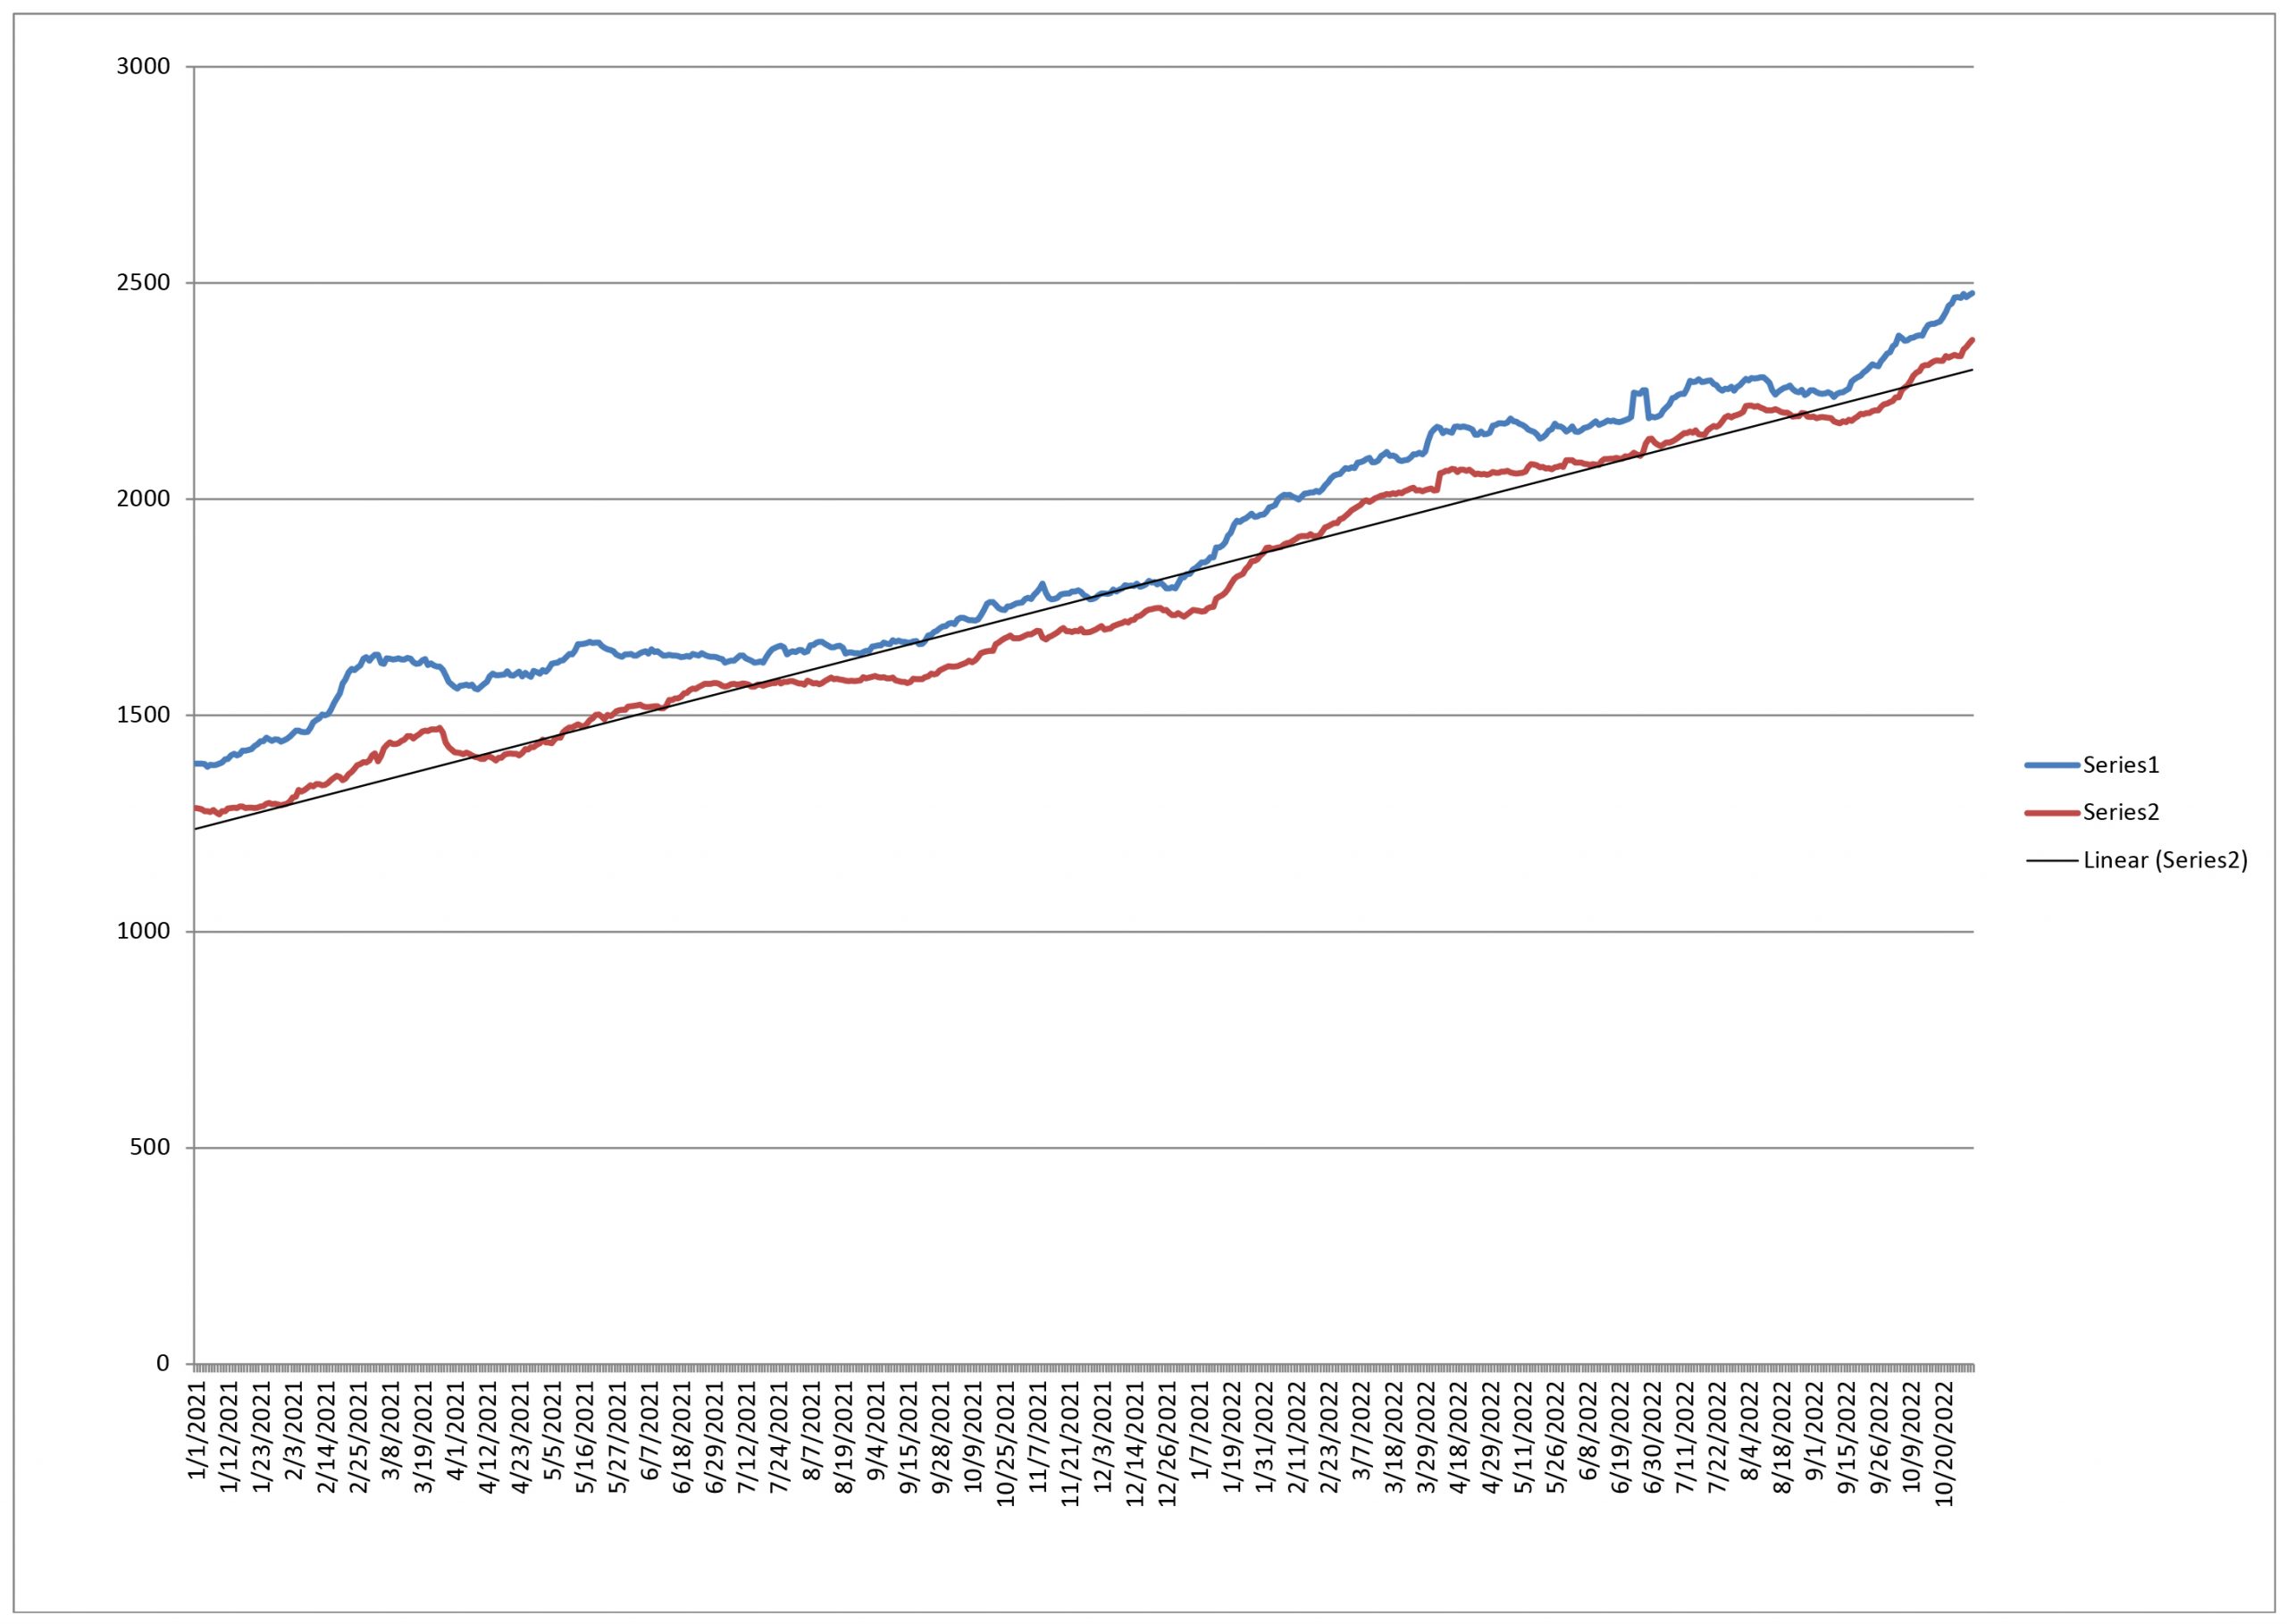
Member Movement through 31 October 2022
OVID subscriptions are up 6.5% in the month of October! The increase of paid subscriptions is 144, the most of any one month this year, even beating January which was our previous best. The total amount of paid subscriptions is now up to 36% for the year; last year, the total for 12 months was up 35%.
Conversion and Churn through March 2022
Monthly conversion and churn rates from August 2022 through March 2022.
OVID in 2021: An End of Year Report
As year 2021 comes to a close and our numbers have finalized, I thought I ought to sum up in one place the main quantifiable changes in key areas of OVID’s development, taking the opportunity to double-down on one of our founding principles: radical transparency.